If you are watching the Puerto Vallarta real estate market from the outside, it can feel contradictory. A beautiful condo is still selling. A well-priced house can still attract serious buyers. New towers keep appearing. And yet, there are more listings sitting around than anyone wants to admit.
I think the simplest way to describe July is this: the market is moving, but it has stopped rewarding wishful thinking.
The buyers are here. They are simply taking their time, comparing resale against pre-construction, asking harder questions about HOA fees and rental rules, and refusing to chase a seller’s idea of what a property should be worth. That is not bad news for Puerto Vallarta. It is what a more mature market looks like after several years, when many properties were sold because buyers feared that waiting would cost them more.
July’s public MLS/IDX data point to slower activity inside Puerto Vallarta proper, led by a drop in condo closings. The wider Puerto Vallarta-Riviera Nayarit market tells a steadier story. Both can be true, and that is exactly why readers need to be careful when an agent treats the whole bay as one market.
The July number that matters most: fewer condo closings
The most specific public snapshot available for Puerto Vallarta separates the city market from the Riviera Nayarit communities, which are carried on different MLS/IDX area pages. It recorded 58 closed listings of all types in July, including 45 condos and 10 houses. Houses and condos together accounted for 55 residential closings.
The comparison with June needs a small warning label. The live source overwrites its monthly statistics, so the earlier figures now survive only in the public search index rather than on a permanent archived report. It is a reasonable prior-month comparison, but I would still call it provisional until the same FlexMLS filter is exported or archived.
| Puerto Vallarta MLS/IDX filter | July 2026 | Earlier indexed monthly snapshot* | Change |
|---|---|---|---|
| Active listings, all property types | 2,145 | 2,084 | +2.9% |
| New listings, all property types | 61 | 120 | -49.2% |
| Closed listings, all property types | 58 | 79 | -26.6% |
| Average days on market, all types | 242 | 206 | +17.5% |
| Condo closings | 45 | 68 | -33.8% |
| Condo average sold price | US$468,943 | US$464,260 | +1.0% |
| Condo average days on market | 189 | 254 | -25.6% |
| House closings | 10 | 10 | Flat |
| House average sold price | US$980,564 | US$364,632 | +168.9% |
| House average days on market | 317 | 185 | +71.4% |
*The earlier snapshot is treated as the likely June comparator, but is not a permanent monthly archive. The percentage changes should be described as provisional.
The headline is the condo number. Closings dropped from 68 to 45 in the comparison set, while the average condo sold price barely changed. That is a slower sales pace, not a sudden collapse in condo values.
The house average is even more important for what it does not tell us. Ten house closings is a very small sample. If a few larger homes or villas close in the same month, the average can jump dramatically. An average July of US$980,564 does not mean the typical Puerto Vallarta house became 169% more valuable in a month. It means a different mix of houses sold.
Anyone can make a market look hotter by quoting the most flattering average. The useful questions are whether comparable properties are closing, how long it is taking, and how much the seller has had to give up to get there.
The broader bay is steadier, but do not mix it with Puerto Vallarta proper
A public July broker summary covering Puerto Vallarta and Riviera Nayarit reported 102 residential sales and US$55.8 million in sales volume, comprising 75 condo and 27 house closings. That is useful regional context, but it is not a Puerto Vallarta city-only number.
For comparison, broader regional MLS reports recorded 98 closings and about US$49.84 million in July 2025. Treated as a rough comparison, that suggests regional sales were up around 4% and dollar volume around 12% year over year.
I would not build an official price index from that comparison. The public reports come from different brokers and may use different MLS area, status, and property-type filters. Still, it gives us a helpful directional reading: the broader bay did not suddenly stop transacting in July, even as activity inside the Puerto Vallarta-only filter slowed.
This is the problem with broad statements such as “Vallarta sales are up” or “Vallarta sales are down.” A buyer looking in Versalles, a seller in Amapas, and an investor comparing Bucerías with the Hotel Zone are not operating in the same market.
What is actually selling
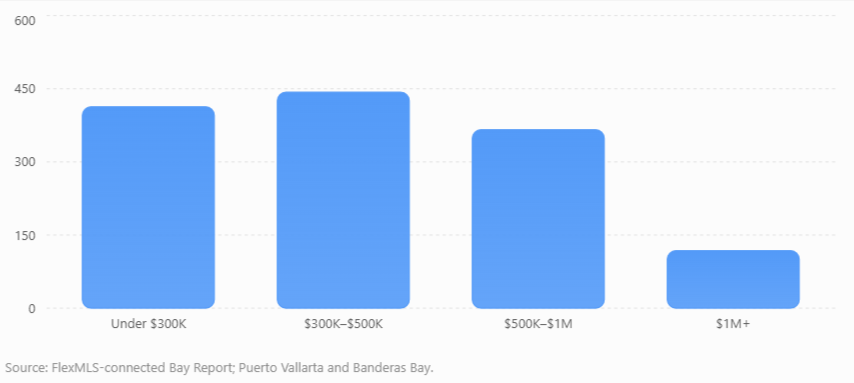
The most useful longer view comes from a FlexMLS-based study of 1,340 settled residential sales across Puerto Vallarta and Banderas Bay in the 12 months ending July 31. The story is very clear: the market center is below US$500,000.
| Sold price range | Closings | Share of all closings | Typical product | Where sales concentrated |
| Under US$300,000 | 413 | 31% | About 66 m², usually 2 bedrooms | Versalles, Centro |
| US$300,000-US$500,000 | 443 | 33% | About 102 m², usually 2 bedrooms | Marina, Romantic Zone |
| US$500,000-US$1 million | 366 | 27% | About 147 m², usually 2 bedrooms | Marina, Romantic Zone |
| US$1 million and above | 118 | 9% | About 274 m², usually 3 bedrooms | Marina, Conchas Chinas |
Put another way, 64% of the recorded sales were below US$500,000 and 91% were below US$1 million. The two-bedroom property was the workhorse, accounting for 44% of all closings at a median sale price of US$400,000.
For a buyer, this is where the market has the most evidence behind it: established condos or smaller homes with a practical layout, a manageable ownership cost, and a location that works when you are actually living here rather than just looking at a sunset photo online.
There is also still a real premium for a view. The same analysis estimates an ocean-view premium of about 33% per square meter. But a view is not a blank check. Buyers will pay more for it when the building, location, and ownership costs align.
What is sitting, and why
Here is the part sellers should pay attention to. Across the trailing 12 months, median days on market were 232. Only 12% of properties sold within 90 days. Twenty-nine percent were still unsold after a year.
The negotiation numbers are just as revealing. Sixty-seven percent of completed sales closed below asking price, and the median reduction from the first asking price to the final sale was 5.2%. Only 11% sold above asking.
That is not a market where waiting quietly for the “right buyer” is a strategy. It can work for a genuinely rare property with a sensible asking price. For ordinary listings, a seller who starts too high will often spend months educating the market about a price buyers have already rejected.
The properties that sit tend to have one or more of the same problems: they are priced relative to an old comparable, they carry an HOA cost that is hard to justify, they need work, or they compete against a newer building without acknowledging the difference in value.
I would add one more category: listings marketed as an investment that only work as an investment if every optimistic assumption comes true. Buyers are more skeptical about that math now, and they should be.
Pre-construction is the market’s biggest optical illusion
When you hear that the Bay has 30 months of inventory, it is worth asking what kind of inventory we are talking about.
About half of the active listings in the broader bay-wide dataset were pre-construction. Those units accounted for only 28% of last year’s closings. They carried an average price-per-square-meter premium of roughly 11% over resale, and their median days on market were 373, compared with 199 for resale.
| Bay-wide trailing 12 months | Pre-construction | Resale |
| Share of active inventory | about 50% | about 50% |
| Share of completed closings | 28% | 72% |
| Reported sold price per m² | about US$4,102 | about US$3,693 |
| Median days on market | 373 | 199 |
The practical takeaway is not that buyers should avoid every presale project. Some have strong locations, credible developers, and payment schedules that make sense for the buyer. But resale has a major advantage: you can see what you are getting, inspect the building, understand the actual HOA, and compare it against nearby completed product.
For a seller of a finished resale condo, do not price it as if it were a new unit with a future delivery date and model-suite finishes. But do use the amount of pre-construction on the market to understand why buyers have become more deliberate.
Neighborhoods are telling different stories
The following figures are trailing-12-month results, not July-only sales counts. That makes them much more useful than a one-month sample when judging neighborhood liquidity.
| Area | Median sold price | Median days on market | Existing-home supply | Pre-construction share |
| Romantic Zone | US$425,000 | 213 | 12.8 months | 54% |
| Centro + 5 de Diciembre | US$357,000 | 180 | 12.8 months | 59% |
| Conchas Chinas | US$978,000 | 190 | 16.2 months | 5% |
| Amapas | US$725,000 | 181 | 16.9 months | 53% |
| Marina Vallarta + Hotel Zone | US$510,000 | 321 | 22.4 months | 66% |
| Versalles + Fluvial | US$329,000 | 274 | 13.0 months | 69% |
Centro and 5 de Diciembre had the shortest published marketing time in this group, followed closely by Amapas and Conchas Chinas. Marina and the Hotel Zone were much slower at 321 days, with the deepest resale supply. Versalles and Fluvial also had a long marketing period, even though their headline existing-home supply was lower; 69% of the displayed inventory there was pre-construction.
There is an important warning about changes in neighborhood prices. A higher median does not automatically mean that all homes in the neighborhood gained value. It may simply mean that more expensive properties closed during the period. This is particularly true in Marina and the Hotel Zone, where a large reported increase in the median sold price is accompanied by the slowest marketing time in the group.
So, is this a good time to buy or sell?
If you are buying, I think this is a better environment than the frantic market many people remember. You have time to look properly. You can compare two buildings rather than accept the first reasonable option. You can ask what the HOA is actually spending money on. You can question a rental projection. And, in many cases, you can negotiate.
If you are selling, this is still a workable market. But the property needs to be presented as a real alternative to what the buyer can purchase today. That means using recent closed sales, not active listing prices, as the starting point. It also means being honest about condition, HOA costs, noise, stairs, parking, rental restrictions, and anything else a buyer will discover anyway.
If you already own and are not selling, do not let a single monthly average make you anxious or overly confident. A two-bedroom in a well-run building near the beach has a different market from a large hillside villa or a presale unit delivering in 2028. Your building, your floor plan, and your actual carrying costs matter more than the headline.
My read on July
Puerto Vallarta is not in a broad real estate crash. There were still 1,340 residential closings across Puerto Vallarta and Banderas Bay in the 12 months ending July, up 17.8% from the prior 12-month period.
But it is also not a market where price growth can be assumed simply because Puerto Vallarta remains desirable. The bay-wide median sold price rose 8.3% to US$403,000, while median price per square meter slipped 1.8% and median time on market increased 45%. That tells me the market is sorting itself out. Larger and more expensive properties are influencing the median, but buyers are taking longer and are not treating every listing as urgent.
For Insider readers, the useful conclusion is simple: this is a market for comparison, not panic. There are still good purchases. There are still good sales. The difference is that both now require more work than they did a few years ago.
And honestly, that is healthier for Puerto Vallarta in the long run.
How this report was built
This article uses public MLS/IDX statistics and FlexMLS-connected market studies. Puerto Vallarta-only figures refer to the public Puerto Vallarta MLS/IDX area filter, which separates Riviera Nayarit communities on other pages. It is not a municipal deed registry, and it may not include private transactions or direct developer sales that never enter the participating MLS.
The July-versus-prior-month Puerto Vallarta comparison should be read as provisional because the prior public snapshot is no longer preserved on a stable report page. The broader July 2026 versus July 2025 comparison is regional and directional because the two public reports may use different filters.
All prices are reported in U.S. dollars. Market data are deemed reliable but are not an appraisal, legal advice, or investment advice.