Puerto Vallarta’s Civil Protection advisers say the Pacific is only halfway through this year’s storm count—and the hottest water is still ahead. The science backs the warning. September and October are the peak, and sea-surface temperatures remain above average in many regions. The numbers indicate that at least ten named systems are already in the basin, with several hurricanes. The lesson for coastal cities is blunt: risk atlases must exist—and must be used. That means zoning decisions, shelters, and alerts based on maps, not politics.
Puerto Vallarta’s message as waters warm
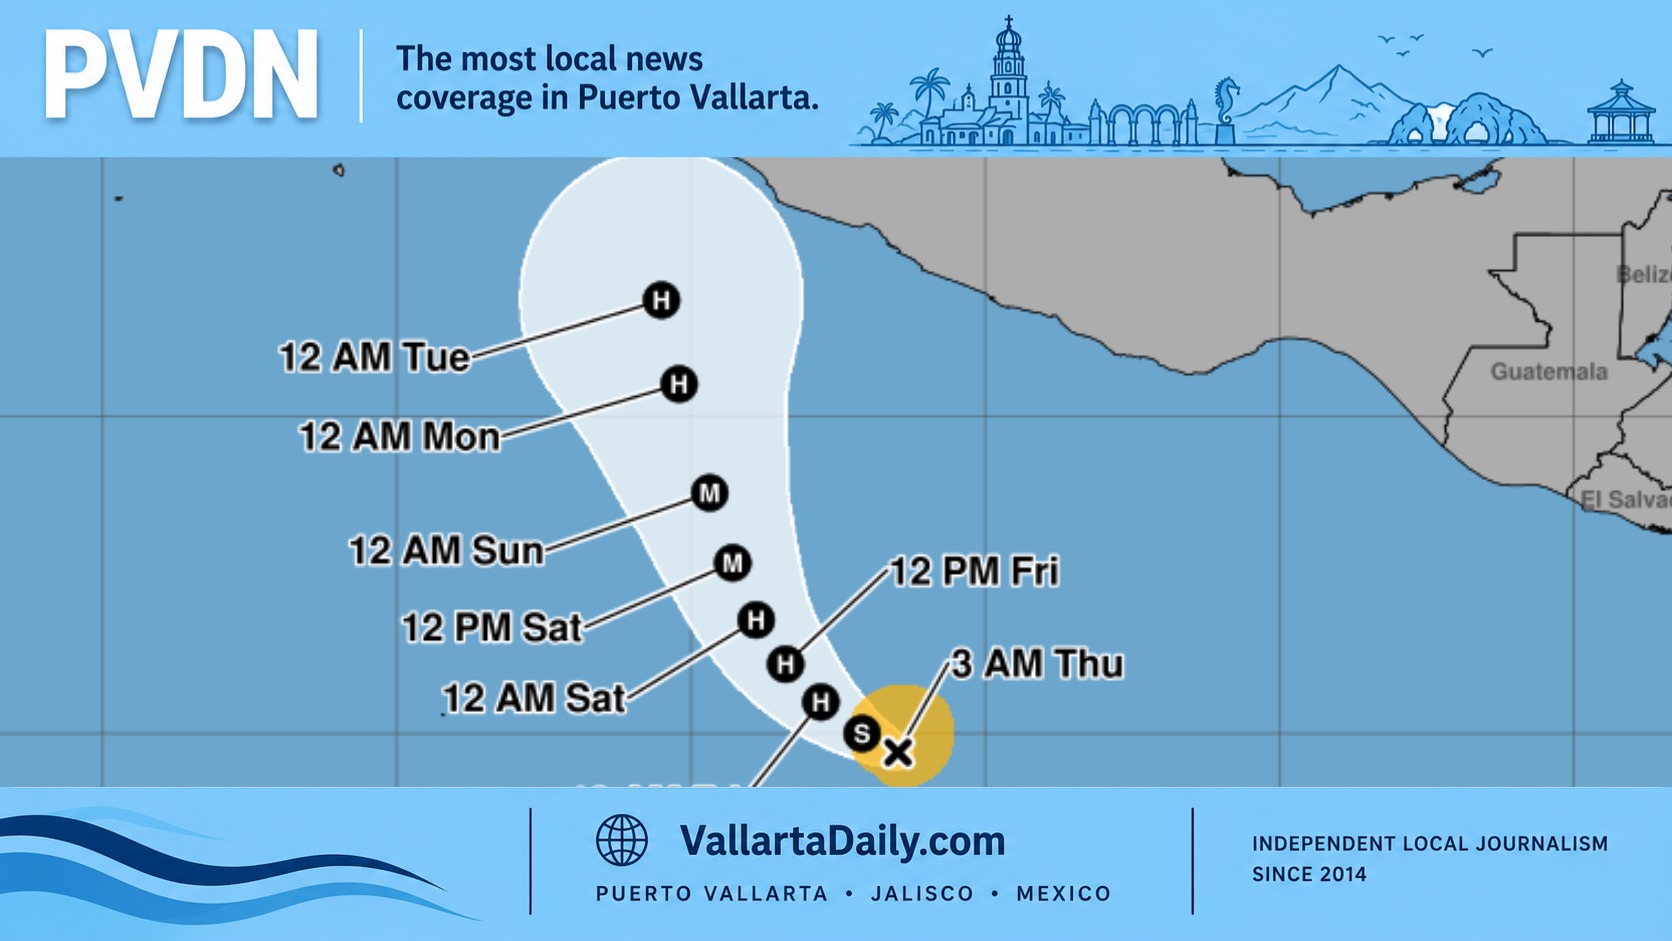
A local Civil Protection adviser, meteorologist Víctor Manuel Cornejo López, reports that the Eastern Pacific has produced ten tropical cyclones so far this season, including five hurricanes, three Category 1 systems, one Category 3 system, and one Category 4 system. His point is simple: warmer seas are priming the basin for more storms as we enter the historical peak. Puerto Vallarta, like every Pacific coast city, sits in a zone of direct risk.
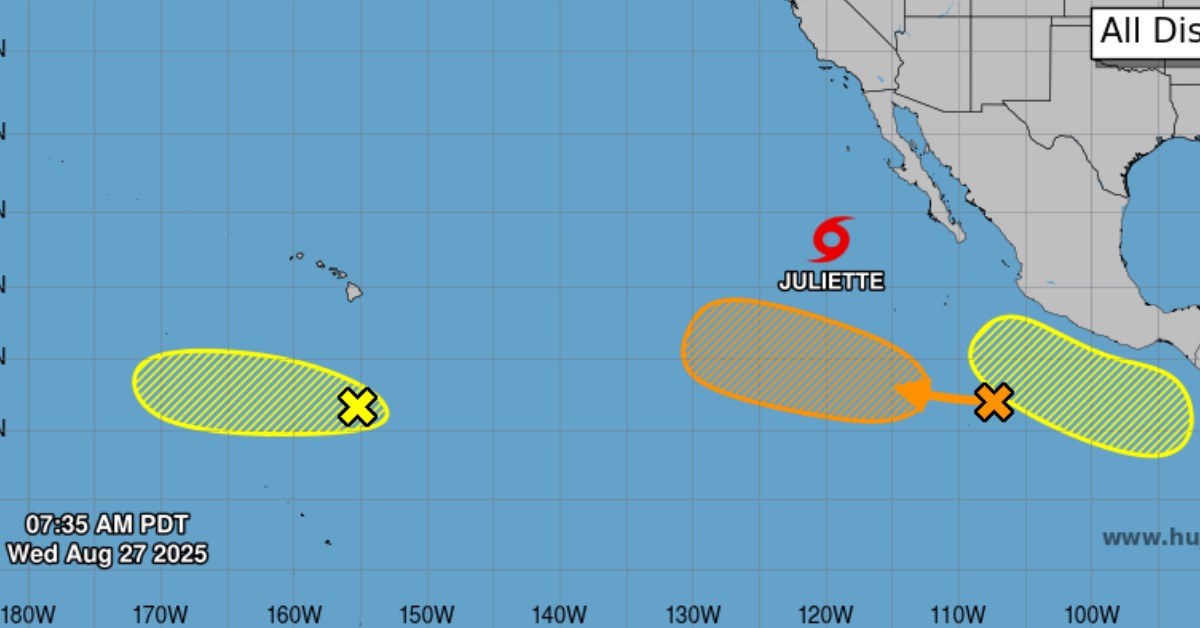
Here is the broader context. The National Hurricane Center’s running tally for the Eastern Pacific shows ten named storms as of August 27, including newly formed Juliette. Of those, four have reached hurricane strength, and two became major hurricanes. Differences between operational counts and local tallies often stem from timing, post-analysis revisions, and whether a forecaster aggregates Central Pacific systems or counts short-lived upgrades. The takeaway for the public is the same: activity is already robust before the peak window.
Pacific tropical cyclones
Climatology is not on our side between now and early November. In the Eastern North Pacific, the most active stretch of time concentrates in late summer and extends into mid-autumn. September and October routinely deliver the highest odds of formation and intensification, which is why coastal communities treat these months as the decisive phase of the season.
That seasonal backdrop is set against an ocean that remains warmer than average across large swaths of the globe. A new World Meteorological Organization update reveals that sea-surface temperatures are broadly above normal for May–July 2025, with slight positive anomalies particularly pronounced in parts of the eastern equatorial belt. Global heat from 2024 has carried over into 2025, even as El Niño faded, leaving ample marine warmth to energize storms that find low shear and moist air.
Real-time NOAA anomaly charts show where that extra heat sits. While the exact values shift day to day, the product consistently highlights positive anomalies along parts of the tropical Pacific, the waters that feed our cyclones. These anomalies are fuel. They help weak disturbances spin up faster and intensify more readily when upper-level winds cooperate.
Forecasts and the local signal
Mexico’s Servicio Meteorológico Nacional projected an above-average Eastern Pacific season this year, estimating roughly 16 to 20 systems. Ten are already on the books with weeks of peak season to go, which tracks with that guidance. NOAA’s outlook framed the basin as near-average overall, but any “average” year still means repeated threats for Mexico’s long, exposed coastline.
History, meanwhile, keeps Puerto Vallarta humble. Category 4 Hurricane Lidia in October 2023 came ashore just south-southwest of the city, a reminder that fast-intensifying systems can tighten the timeline from watch to landfall. Two decades earlier, Category 4 Kenna drove a destructive surge into San Blas and sent damaging waves and debris into Vallarta’s waterfront. These aren’t hypotheticals. They are case studies for what the bay’s arc can experience.
Turn maps into decisions
Cornejo López calls for risk atlases that are “applied,” not box-checking paperwork. Mexican law is explicit here. Article 86 of the General Civil Protection Law requires federal, state, and municipal risk atlases, stating that authorities must use them to approve or deny construction and infrastructure projects. The atlas is intended to guide where housing is located, where channels require clearing, which roads are prone to flooding, and where shelters and hospitals remain viable under wind and surge scenarios.
Puerto Vallarta has a municipal risk atlas and has been updating its map layers in recent years. The city’s transparency portal lists the atlas with a 2021 update and links to natural-hazard maps; the fire and Civil Protection site hosts 2023 atlas map content. This is what “applied” looks like: make the datasets public, push them into land-use files, and hold projects to what the maps show.
Alerts, drills, and the last mile
Even the best maps require an alert system that reaches the intended audience. Mexico’s Early Warning System for Tropical Cyclones (SIAT-CT) exists to standardize color phases, timelines, and actions from the first outlook to landfall and aftermath. When municipalities align everyday operations with SIAT-CT—clearing drains on yellow, staging shelters on orange, and hardening services on red—the city shrinks response times from hours to minutes. That is how you translate climate risk into fewer injuries, less chaos, and faster recovery.
Two other pieces matter—first, shelter capacity and redundancy. If one site floods, there must be others outside surge zones that have power backup and medical coverage. Those locations should be published and repeated on the radio, TV, and social channels before the watches go up. Second, transparency in post-storm data. After each event, cities should publish a brief that tracks peak winds, rainfall, outages, and damage by neighborhood. Those facts feed back into the atlas and expose the weak links—culverts that clog, towers that fail, or neighborhoods that need tree management.
We are now in the most consequential stretch of the season. Official counts already show a busy first half, and local experts expect more as waters stay warm into October. The job for cities like Puerto Vallarta is to assess impact and plan backward from that state. Use the atlas to avoid placing homes and hotels in areas prone to surges and landslide zones. Enforce drainage maintenance on a schedule that matches the color-phase alerts—practice shelter openings as drills, not first-time fire drills on landfall day. If the maps and the system drive those decisions, fewer families will face the most dangerous hours alone.